
WHAT ARE THE ODDS THAT
$TSLA
$AAPL
$NVDA
$META
WILL CLOSE
HIGHER
LOWER
TOMORROW?
Stop guessing & start trading with data-backed probabilities, and A.I. powered research assistants.

A.I. Powered Insights With Years Of Fundamental Data
- 5+ years of fundamental and company data plus current news stories and market sentiment.
- Ask AI anything about a stock’s business model, revenue growth, profit margins, etc. Get instant answers.

Technical Screeners & Quantitative Probabilities
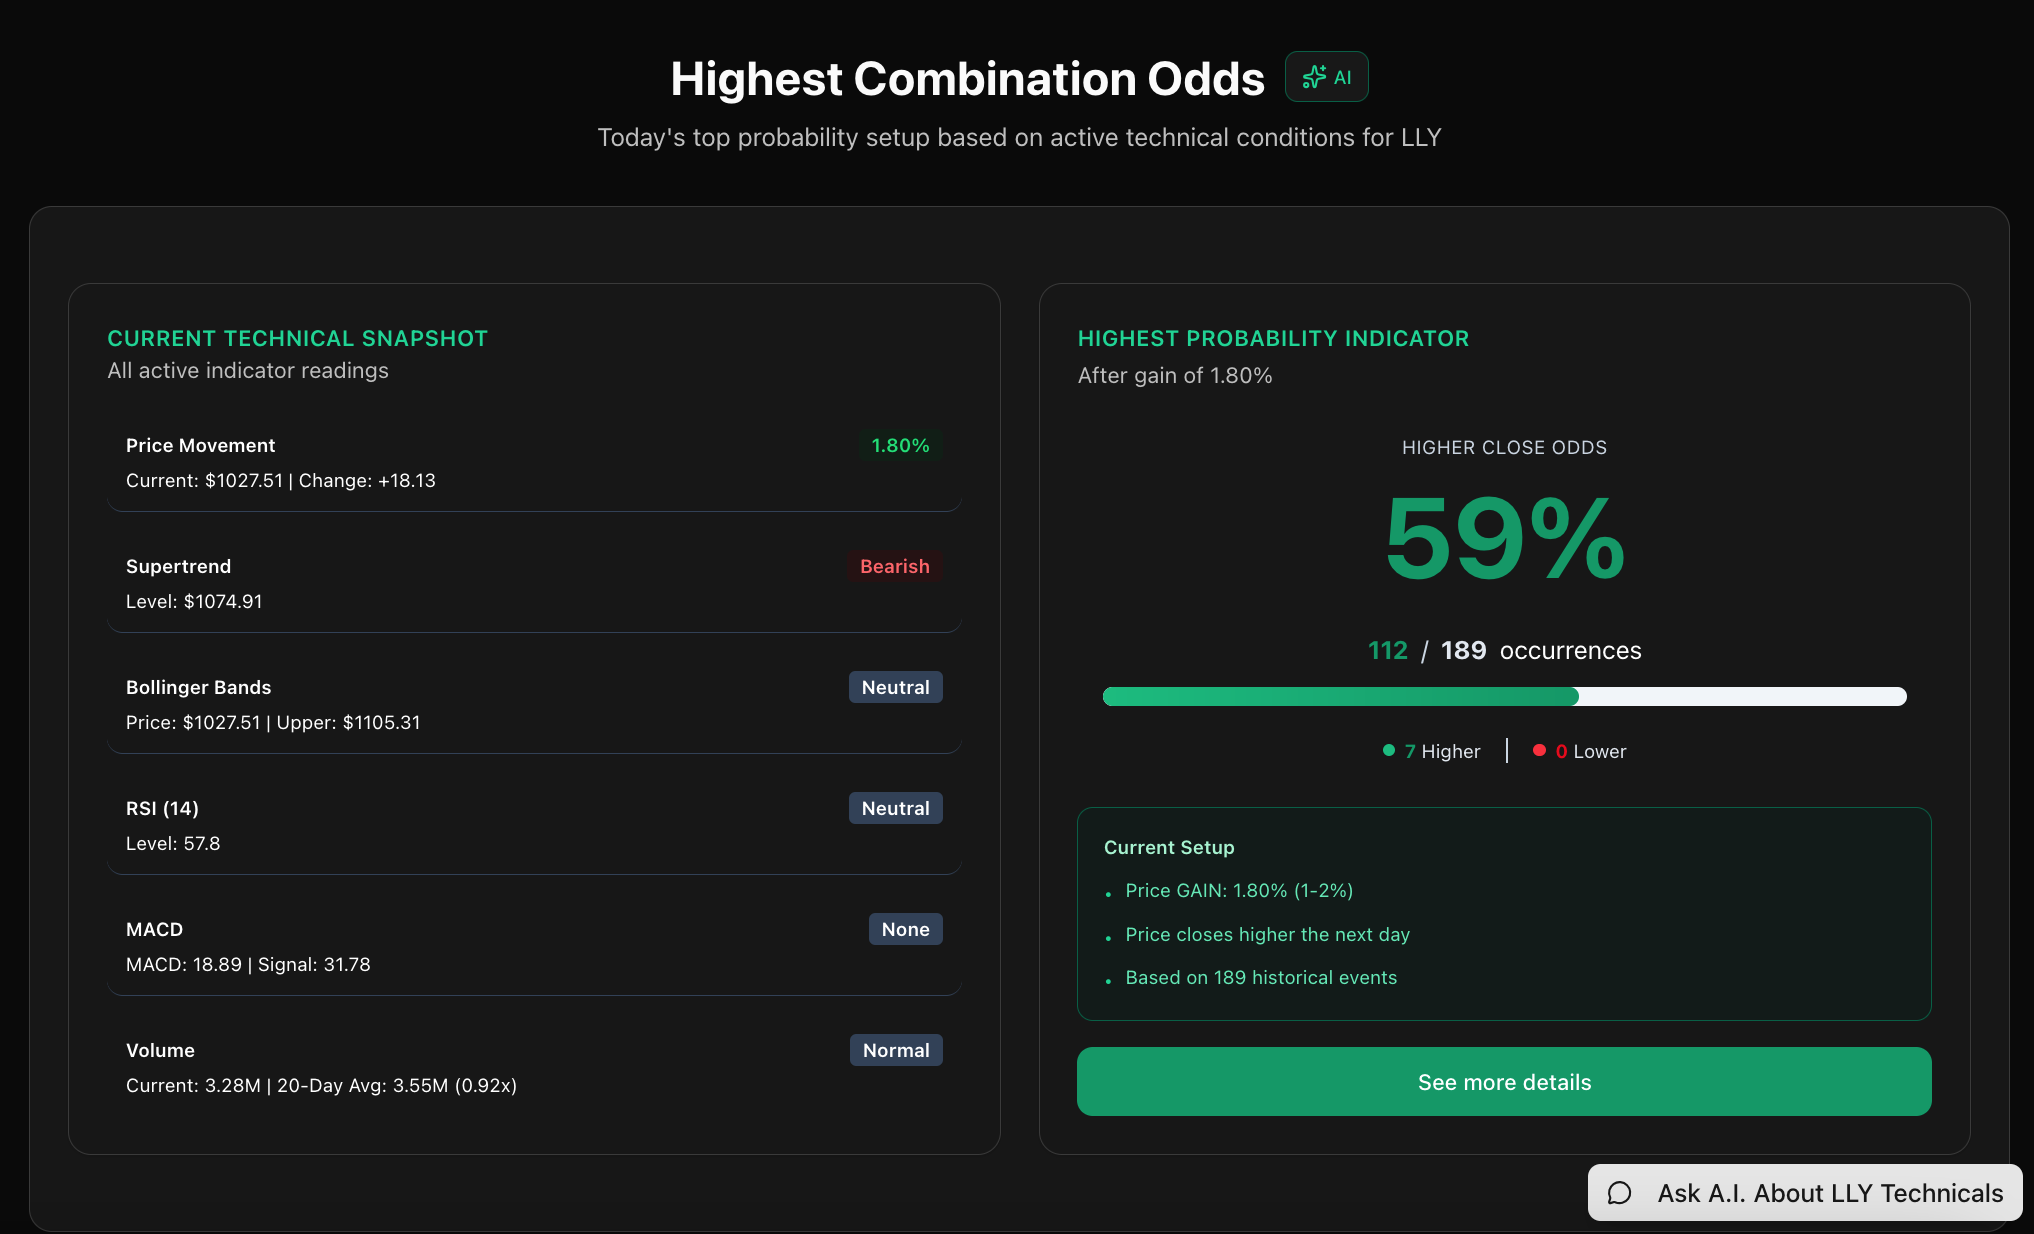
- Scan for daily market movers, technical indicator conditions, and highest probability setups.
- Ex: When RSI is oversold, what percentage of the time does the stock actually close higher the next day?
Market Research for Retail Traders Finally Made Simple
Most platforms make analyzing the markets way more confusing than it needs to be. Chart Odds gives you the main three methods of analysis, in one simple interface.
1
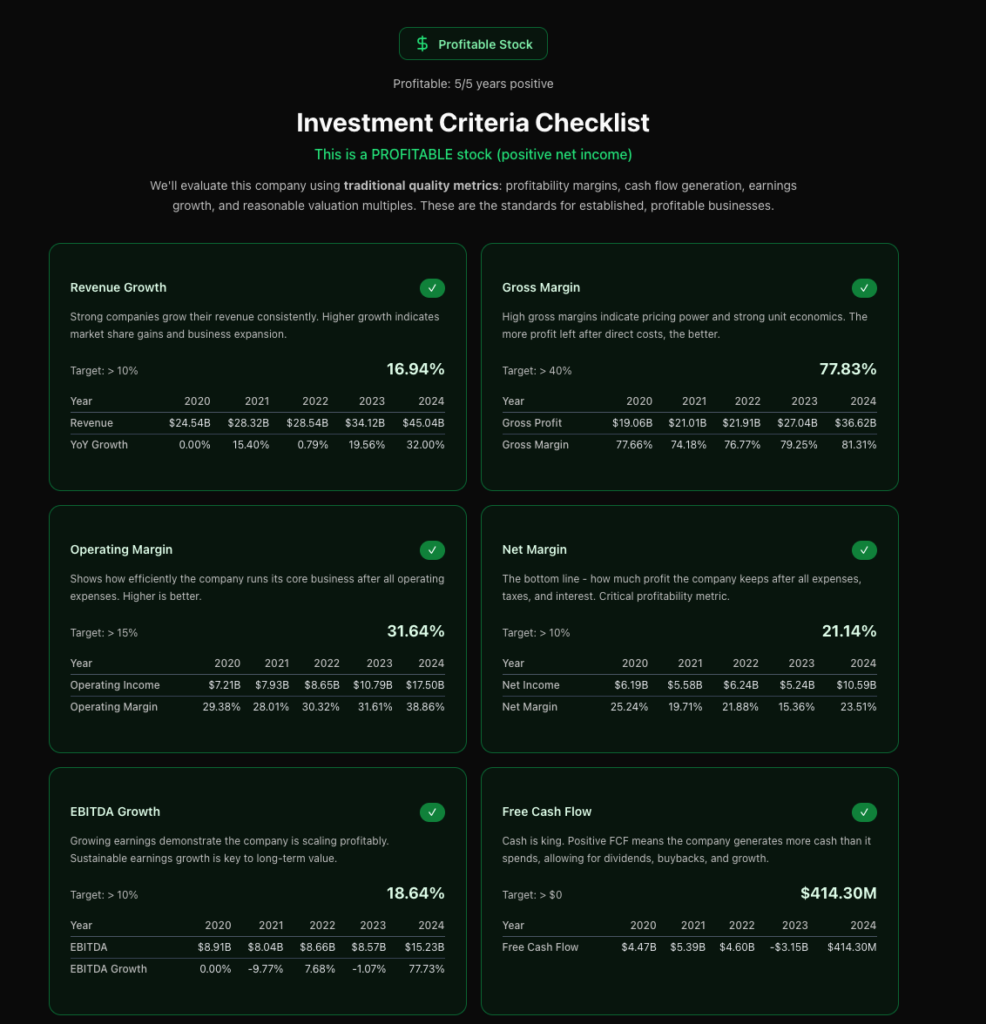
Fundamental Analysis – Analyze what a company does, latest news, and it’s financial health in minutes.
2
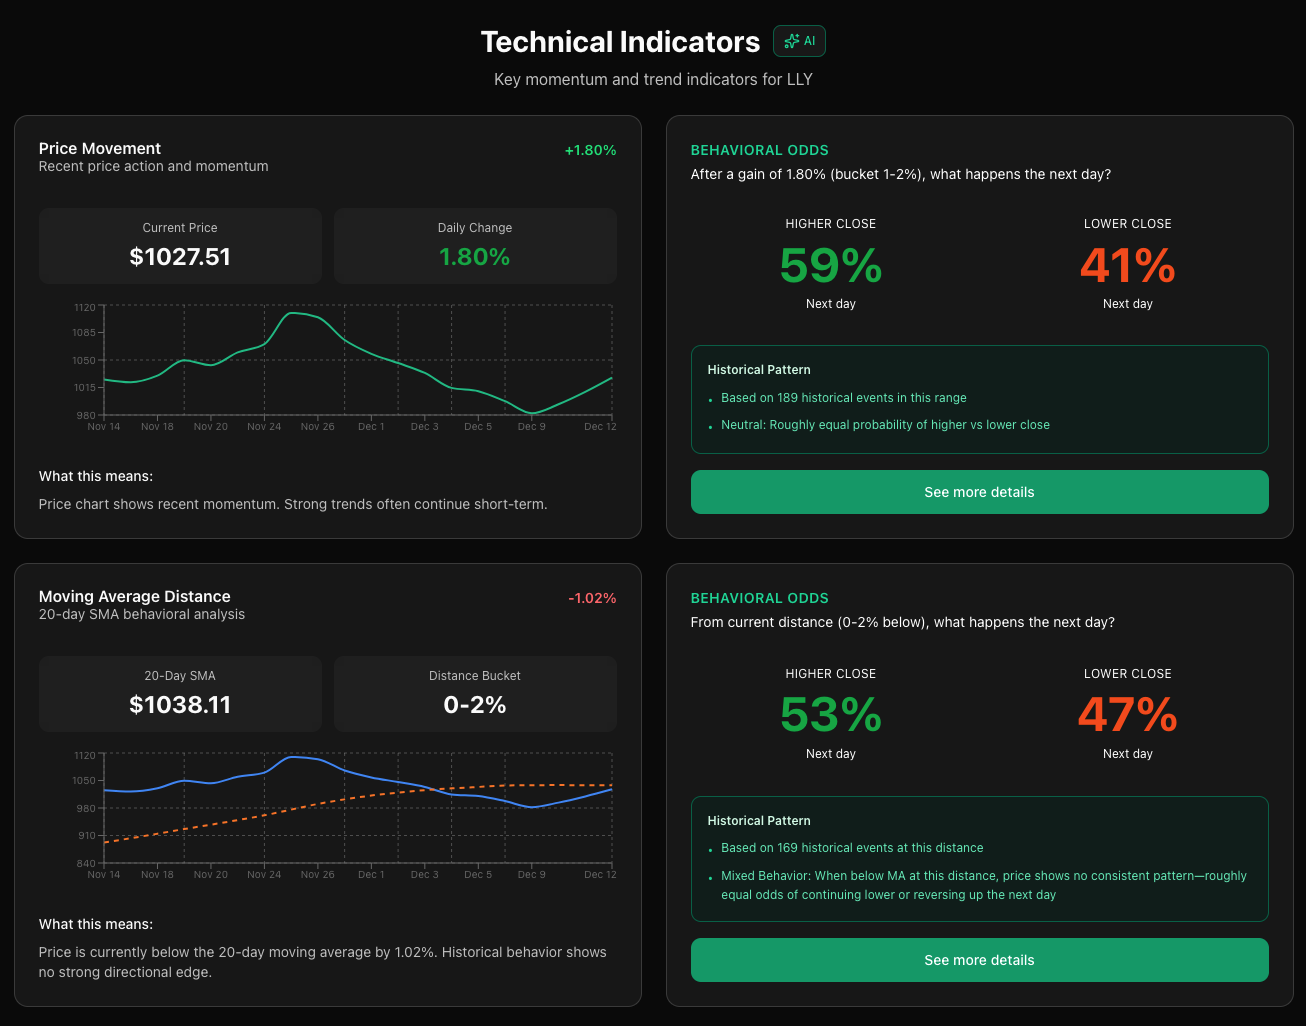
Technical Analysis – Check the charts and popular indicators for the current market conditions.
3
Quantitative Analysis – Discover the mathematical probabilities of a higher or lower close the following day.
Statistical Odds Based On Years Of Backtested Data
- Every probability is calculated from 5 years of historical price data across a variety of market conditions and technical setups.
- If we show 65% higher close odds, it means 65% of similar historical setups actually resulted in higher closes the next day.
Smart Watchlists &
In-Depth Research Tracking
- Smart watchlists that track your ideas with P&L included automatically based on your entry price and direction bias.
- Build complete research reports with screenshots, charts, notes, news links, and AI summaries in one organized workspace.
Perform A.I. Powered Research & Keep Everything Organized
Research fundamentals & perform an easy analysis using our customizable Investment Criteria Checklist. Then you can check for odds and technical setups, or even use external sources for further information & specific deep dives. Upload your findings & screenshots, paste your charts, add notes/news, and generate AI summaries. Stop losing track of your DD across 10 browser tabs…organize everything in one investigation workspace so you can review your complete thesis before entering a trade.
Basic
$47/month
Basic Fundamental & Company Data(5yrs. Of Financial Data)
Basic Technical Screeners & Standard Probability Statistics(5yrs. Of Backtested Data)
Smart Watchlists With P&L Tracking
A.I. Powered Q&A Assistant Plus Summarized Insights
15 Minute Data Delay
15 day free trial
Advanced
$97/month
Advanced Fundamental & Company Data(10yrs. Of Financial Data)
Basic Technical Screeners & Advanced Probability Statistics(10yrs. Of Backtested Data)
Smart Watchlists With P&L Tracking
A.I. Powered Q&A Assistant Plus Summarized Insights
No Data Delay
Professional
$147/month
Advanced Fundamental & Company Data(10yrs. Of Financial Data)
Basic Technical Screeners & Advanced Probability Statistics(10yrs. Of Backtested Data)
Smart Watchlists With P&L Tracking & Advanced Research Tracking Suite
A.I. Powered Q&A Assistant Plus Summarized Insights
No Data Delay
Frequently asked questions
Browse our FAQs for quick and clear information about ChartOdds. If you need further assistance, feel free to reach out, we’re here to help!
Or reach out to us here.
What is Chart Odds?
Chart Odds is a stock research platform that combines fundamental, technical, and quantitative analysis. Using fundamental data, technical indicators, and backtested probability data in one simple interface, we’ve built a platform for retail traders who want institutional-level analysis without the complexity.
Why Should I Use Chart Odds?
How many times have you tried to research a stock and ended up being overwhelmed by all of the data, the charts, the numbers…it becomes a lot to keep track of unless you are a professional who knows exactly what to look for.
Not only does that make it harder to find the key data that you actually need to make decisions, you still don’t even know what the company does, how it makes money, or what are your odds when taking a trade?
Stop juggling five different platforms to research one stock. Chart Odds gives you fundamentals, technical charts, AND probability odds all on one screen. Know the historical win rate of your setup before you enter. Track your watchlist P&L based on your actual entry and direction. Organize all your research in one place instead of scattered across
browser tabs.
What Are The Key Features Of Chart Odds?
- Three-Pillar Analysis: Years of fundamental & company data, technical indicators, and backtested probability odds combined on one screen.
- Market Odds: See the historical win rate for current technical setups so you can know your odds before you trade.
- Pre-Built Scanners: Find stocks hitting daily movers, oversold RSI, MACD crossovers, breakouts, and high-probability setups.
- Smart Watchlists: Track P&L automatically based on your entry price and direction bias (long/short).
- AI Research Assistant: Ask questions and get instant answers about any stock’s news, fundamentals, or technicals.
- Investigation Suite: Upload screenshots, organize charts, save notes, and track news all in one workspace. Generate full deep research reports and ask A.I. for further analysis of your work.
How Do I Sign Up For Chart Odds?
Click “Sign-Up” at the top right of the page and select a plan. Enter your payment information (you won’t be charged during the trial). Complete signup with your email and password. Verify your email to activate your account.
How Do I Use Chart Odds Once I’m Signed Up?
- Finding Daily Trade Ideas
Use the pre-built scanners to find stocks in play ,then check for any high-probability setups in play at the moment. Add promising stocks to your watchlist with entry price and direction. - Checking Odds on a Specific Stock
Already have a stock in mind? Search the ticker and go to the Technical tab to see current market conditions and probability odds. RSI oversold? See the actual win rate. MACD bullish? Check how often that setup worked historically. Make your decision based on data, not gut feeling. - Deep Research & Investigation
Building a longer-term thesis? Check all three tabs: Fundamental (company health, revenue, margins, business model), Technical (charts, indicators, current setup), and Quantitative (detailed backtested probabilities). Build an investigation report—upload screenshots from other platforms, add news links, save AI summaries, organize all your DD in one workspace. Ask the AI assistant questions like “What does this company actually do?” or “Is revenue growing?” - Tracking Your Positions
Add stocks to your watchlist with your actual entry price and direction (long/short). Your P&L calculates automatically based on your thesis. Review your open positions anytime to see how your ideas are performing before going live.
How Do I Know The Odds & Data Are Accurate?
All probability data is backtested on 5 years of historical price data (10 years on Advanced plans) from reliable market data providers. You can verify each individual occurrence at anytime to confirm our results are correct as well. You can do this by clicking the “See Details” button on any odds card to view the complete backtest results and sample size. Fundamental data comes from official SEC filings and verified financial data sources.
Research Smarter with Chart Odds
Chart Odds combines fundamental research, technical analysis, and backtested probabilities in one platform. Stop guessing & start trading with real data.
Stop guessing & start trading with data-backed probabilities, and A.I. powered research assistants.
© 2025 ChartOdds. All rights reserved.